




Price
After iron ore prices experienced two rounds of decline in Q3 2024, favorable policy news in late September led to a price recovery.
Supply and Demand Side
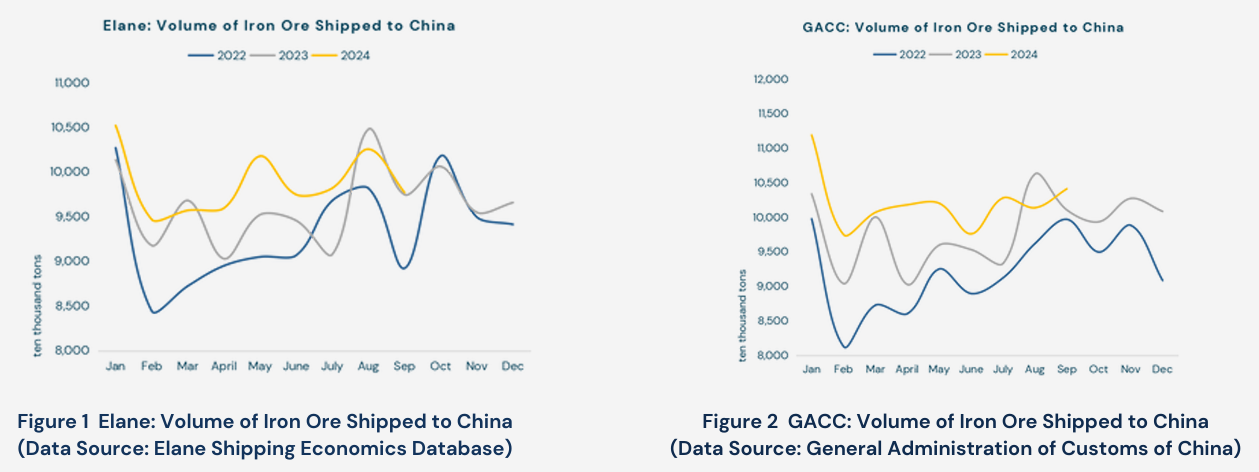
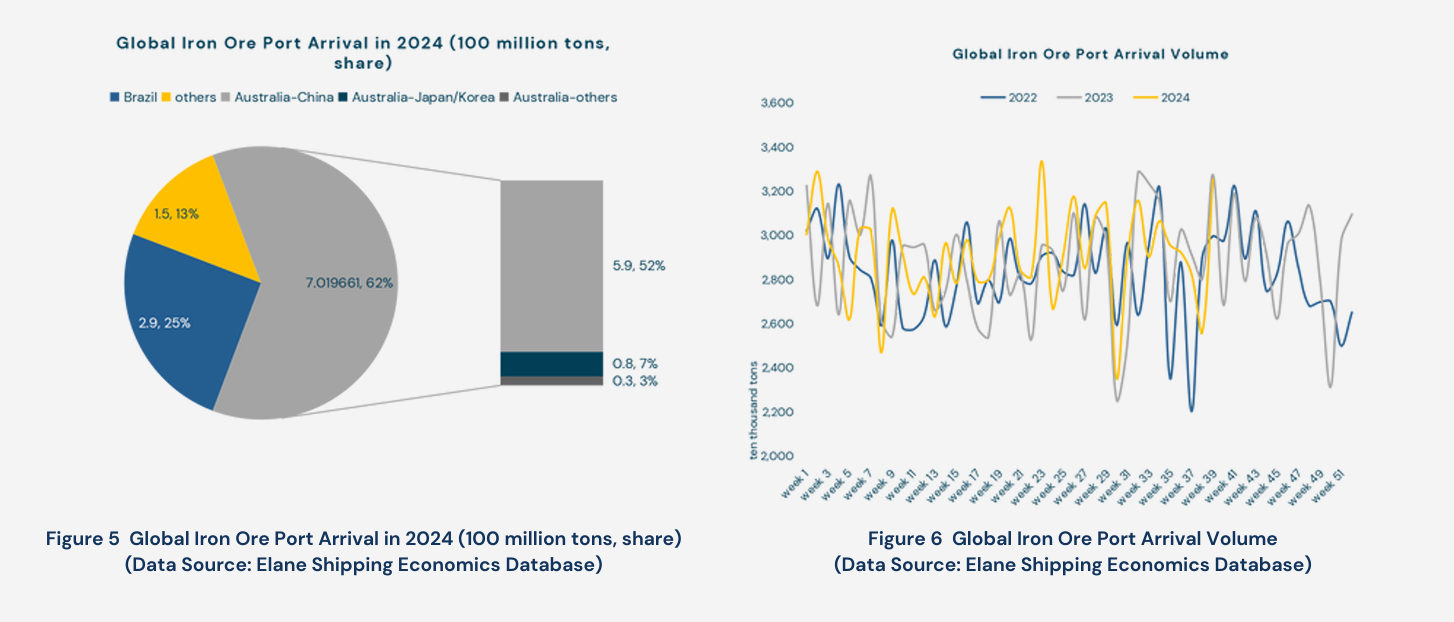
Iron ore arrivals at Chinese ports remained historic highs for the same period in recent two years, marking a year-on-year increase of 1.8%. On the demand side, China's domestic pig iron supply contracted in the first half of the year. In mid-April, raw material prices hit bottom, allowing higher profit margins of steel production. This resulted in a rapid increase in hot metal output, though end-user demand showed no significant increase. In May, hot metal output peaked, leading to a subsequent monthly decrease in apparent iron ore demand.
Transportation
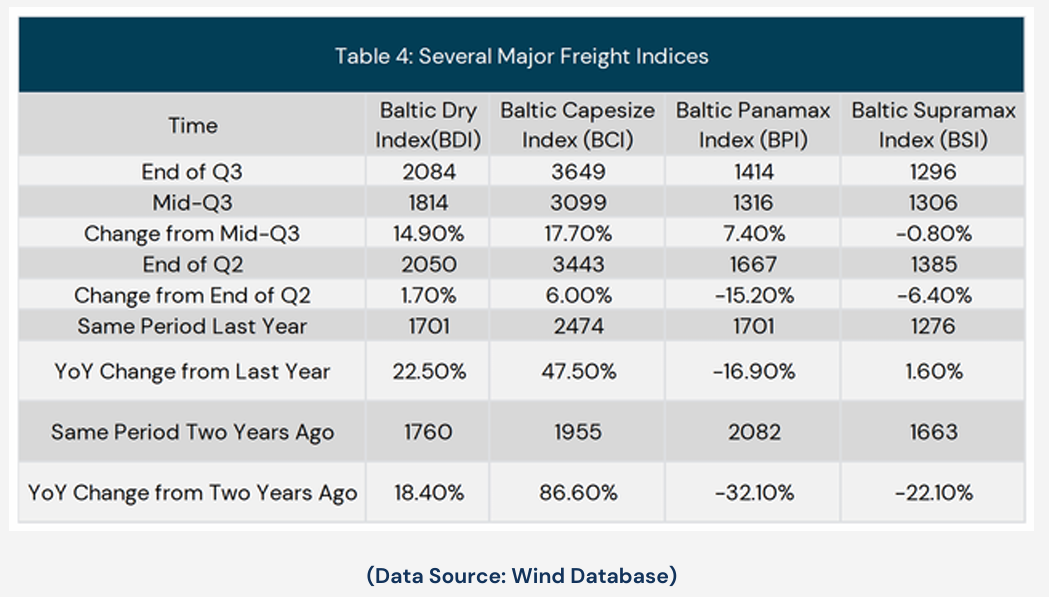
The Lombok Strait, Malacca Strait, and Sunda Strait are major channels for China’s iron ore imports, accounting for 94.5% of Chinese iron ore imports in the first three quarters. The crisis in the Red Sea has driven up demand for Capesize vessels, with freight rates following a "high-low-high" trend in the third quarter, ending the period 47.5% higher year-on-year, leading to elevated seaborne costs for iron ore.
Future Supply
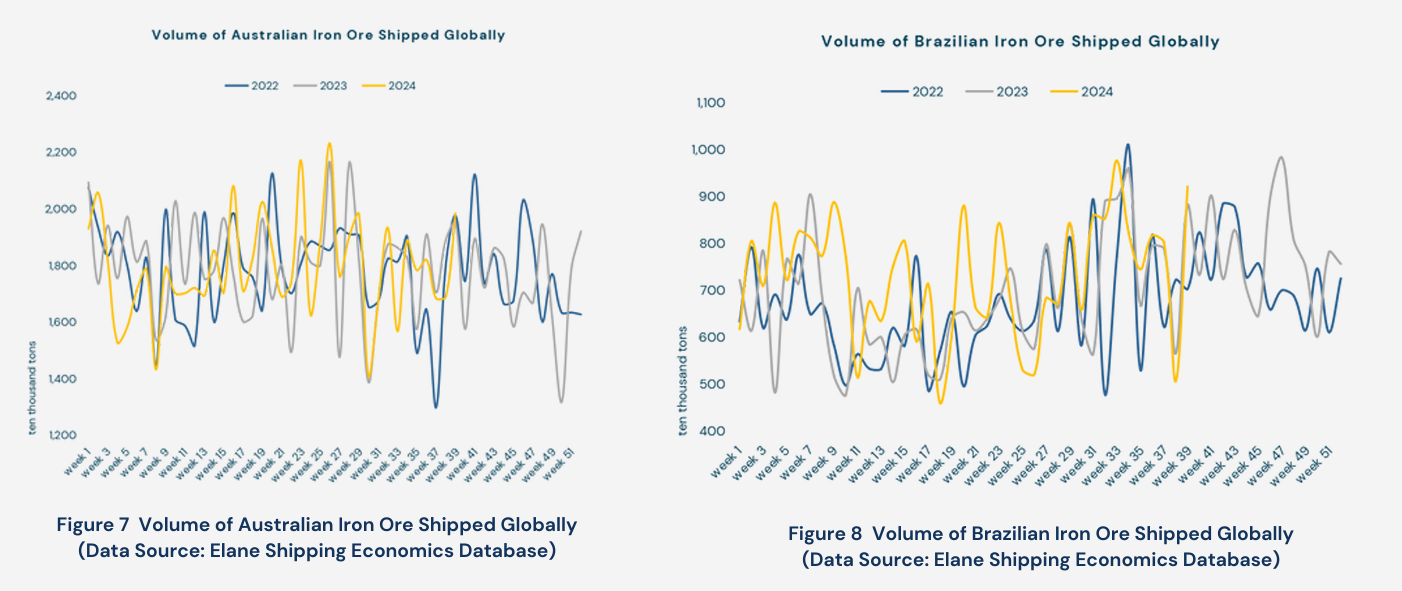
Vessel operational capacity has continuously reached new highs, but new orders began to decline in the third quarter, showing a slight lack of marginal growth momentum. Brazilian iron ore shipments increased substantially in the third quarter, while Australia saw seasonal production cuts. Balancing these fluctuations, China's iron ore arrivals in the fourth quarter are projected to increase year-on-year, indicating a generally loose supply landscape.
In Q3 2024, iron ore supply remained at a steady high, while pig iron output saw a seasonal dip according to National Bureau of Statistics of China. Amid strong supply and weak demand, prices continued to shift downward, with port-imported inventory reaching record highs, signaling an industry-wide passive inventory buildup phase.
Iron Ore Port Arrivals Analysis
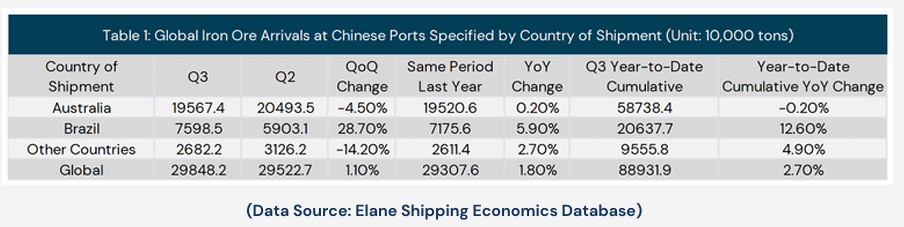
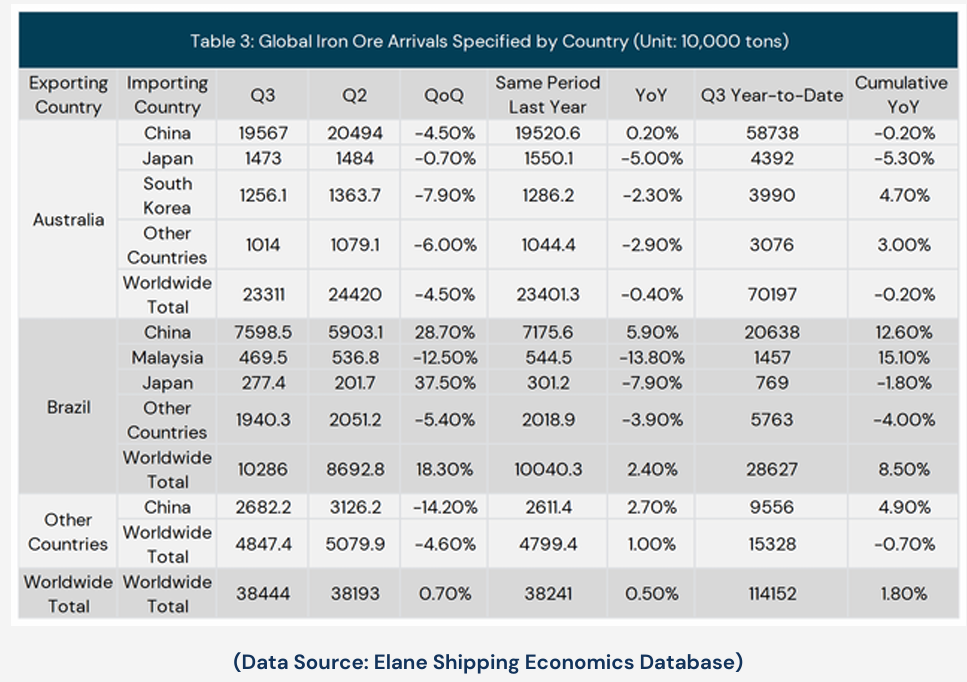
According to Elane data, China received 298 million tons of iron ore in Q3 2024. There is a slight discrepancy compared to China Customs data that arises from concentrated port arrivals efficiency at the end of the month and gaps in land transport data.
Australia and Brazil accounted for 270 million tons of year-on-date cumulative arrivals this year, making up 91% of total China iron ore imports. Brazil's iron ore output rose by 13.8% quarter-on quarter in Q2 and by 12.9% in Q3. With shipping from Brazil to China taking approximately 60 days, there remains significant potential for increased arrivals in China in Q4.
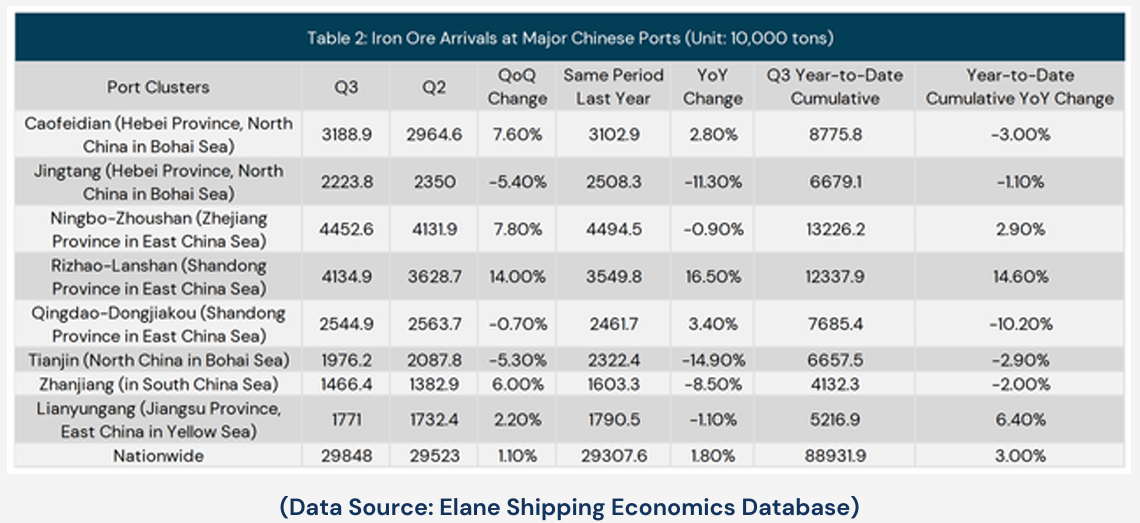
There are some variations in iron ore arrivals among China's major port clusters.
The Rizhao-Lanshan port cluster saw the fastest growth, with a 14.6% cumulative year-to-date increase. In contrast, the Qingdao-Dongjiakou port cluster recorded a cumulative year-to-date drop of 10.2%, as Qingdao Port has been focusing on high-value-added container vessel arrivals and distributing bulk cargo vessels to Rizhao and Yantai, Shandong province, east China.
Arrivals at the Jingtang-Caofeidian, Zhanjiang clusters showed a significant year-on-year decline in Q3. Caofeidian-Jingtang port clusters are used as indicators for raw material demand in north China, and Zhanjiang port as an indicator for the raw material demand in South China, therefore this decline of arrivals aligns with Q3’s continued decline in hot metal production.
The Ningbo-Zhoushan and Shandong Peninsula clusters, key transit hubs for inland areas with weaker resource endowments, experienced a broad-based increase in arrivals in Q3. As iron ore prices have been trending down, port-imported inventories continued to rise, while steel mill inventories remained low. This indicates that some traders and industrial enterprises have restocked iron ore in response to speculative demand.
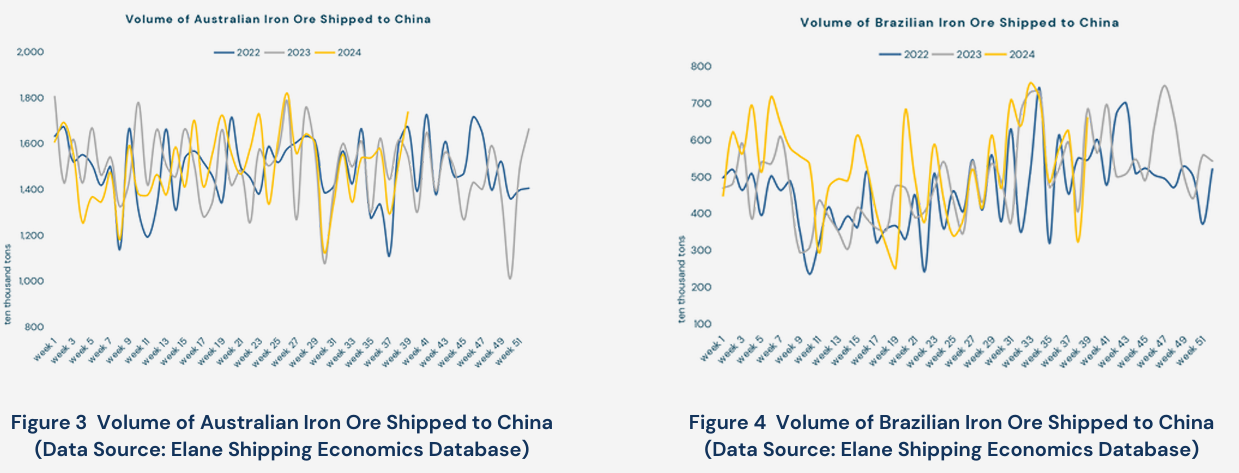
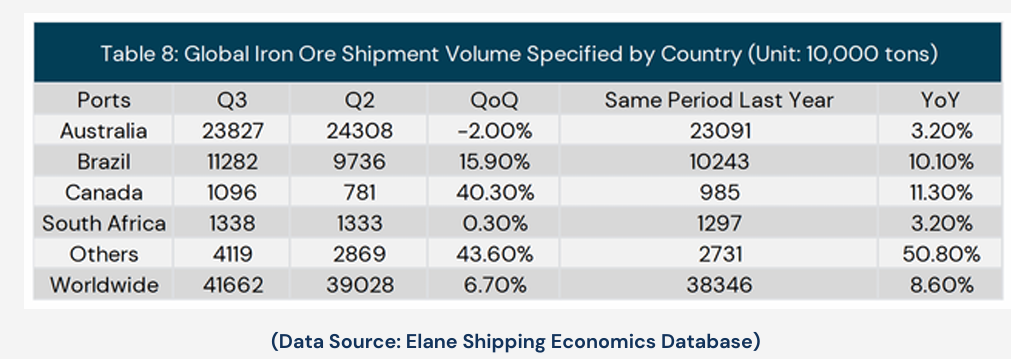
In Q3, Australia's iron ore exports totaled 230 million tons, a 0.4% year-over-year decrease and a 0.2% cumulative drop year-to-date. Australia's fiscal year runs from July to June; thus, production typically ramps up toward the fiscal year-end, aligning with China's Q2. Production intensity typically declines in Q3 as mines and equipment undergo maintenance. But in Q3 2024 there's no major production decline and the production and sales rhythm remains stable.
In Q3, Brazil's total exports reached 103 million tons, an 18.3% quarter-over-quarter increase, with notable volume growth in shipments for China, up by 16.95 million tons in Q3 alone.
Q3 arrivals from India and South Africa to China saw modest growth. However, like Brazil, non-Asian routes experienced a general decline in Q3 shipments, with arrivals mainly concentrated in European countries.
Iron Ore Shipping Efficiency
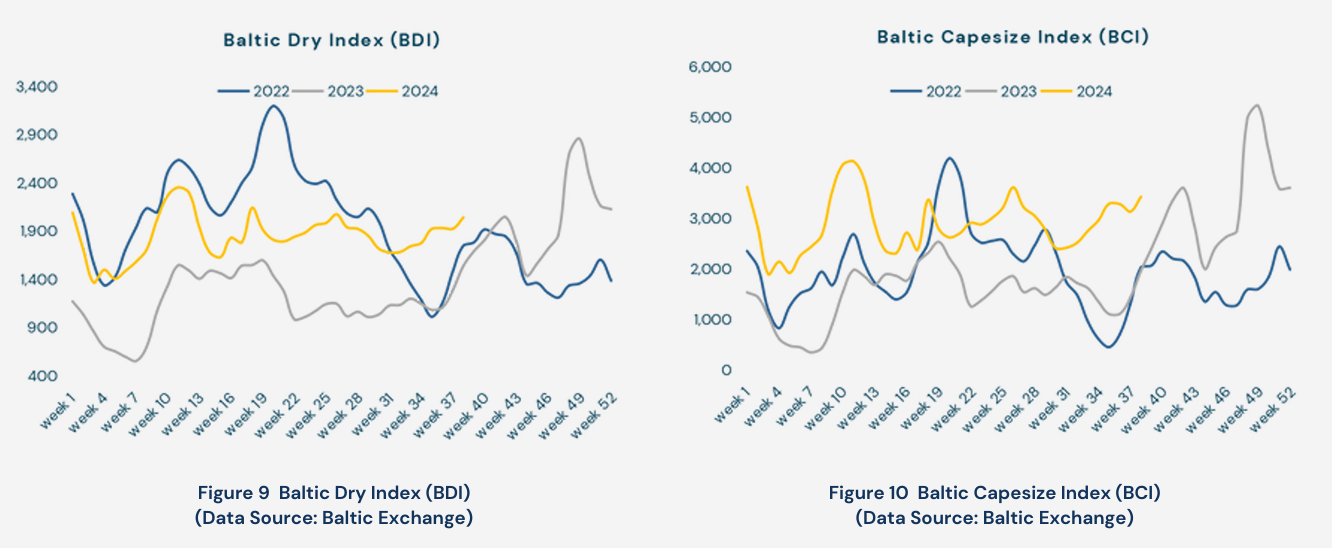
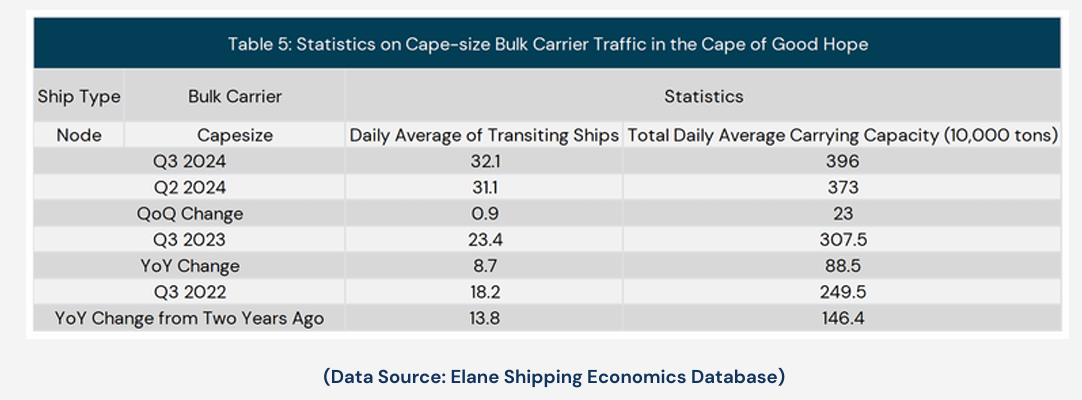
Under the pressure of capacity constraints, dry bulk shipping routes have lengthened, driving up iron ore freight rates. At the end of the third quarter, the BDI index closed at 2084, with a year-on-year increase of over 18% compared to both the previous two years, approaching this year's peak. The BCI index has the highest weight within the BDI index, and the crisis in the Red Sea resulted in an increase of 9.1 vessels in average daily Cape-size traffic in the third quarter year-on year.
Although the Red Sea is not a mainstream route for iron ore, the third quarter is the peak season for coal-fired power demand, which has squeezed shipping capacity for iron ore. The lack of significant year-on-year increases in other indices also supports the idea that the overall lengthening of dry bulk shipping routes this year is a direct driver of rising iron ore freight rates.
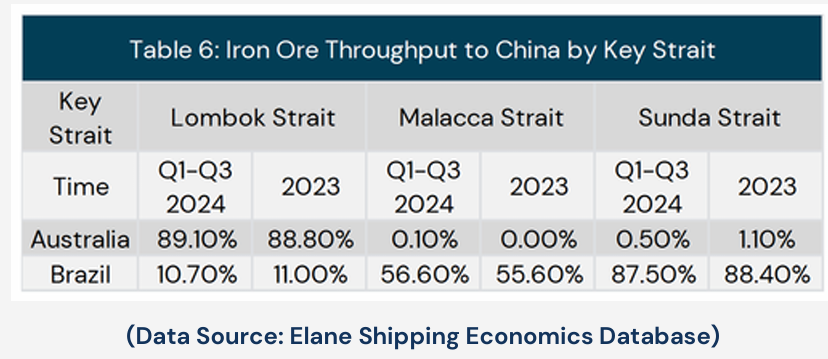
China's iron ore import shipping routes are characterized by a "one main and two wings" pattern. The three major routes pass through the Lombok Strait, Malacca Strait, and Sunda Strait. By the end of the third quarter, the total volume from these three routes accounted for 94.5% of China's port arrivals of iron ore.
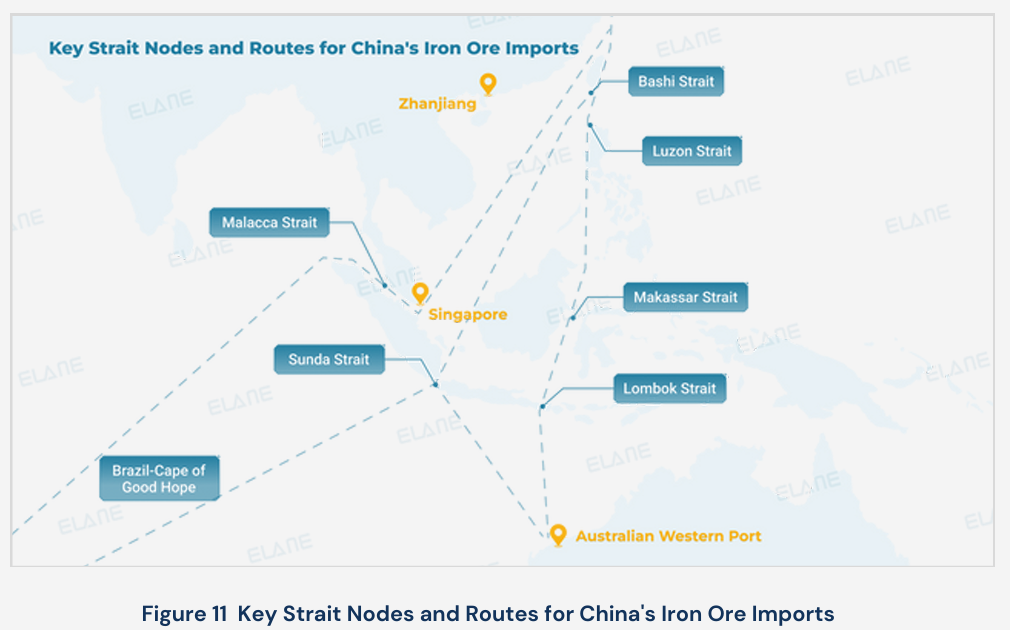
In short-distance transportation, the Lombok Strait serves as a key node in China's core iron ore shipping routes. The Malacca Strait is the main artery for long-distance transport to China, while the Sunda Strait also diverts some large vessels.
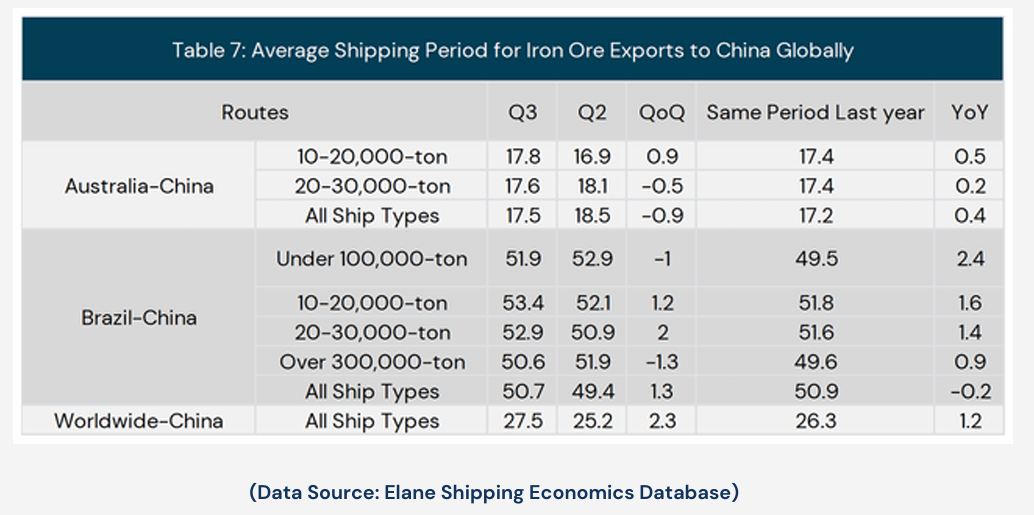
In the third quarter, the average shipping time from Australia to China was 17.5 days, while from Brazil it was 27.5 days, with larger vessels demonstrating higher efficiency than smaller ones.
Future Supply
The increase in global iron ore shipments is coming from Brazil, while Australia has entered a seasonal reduction phase. Based on shipping schedules, all shipments are expected to arrive in major demand countries by the end of November. In Europe, iron ore port arrival data decreased in the third quarter, while shipments increased, possibly due to passive inventory replenishment demands.
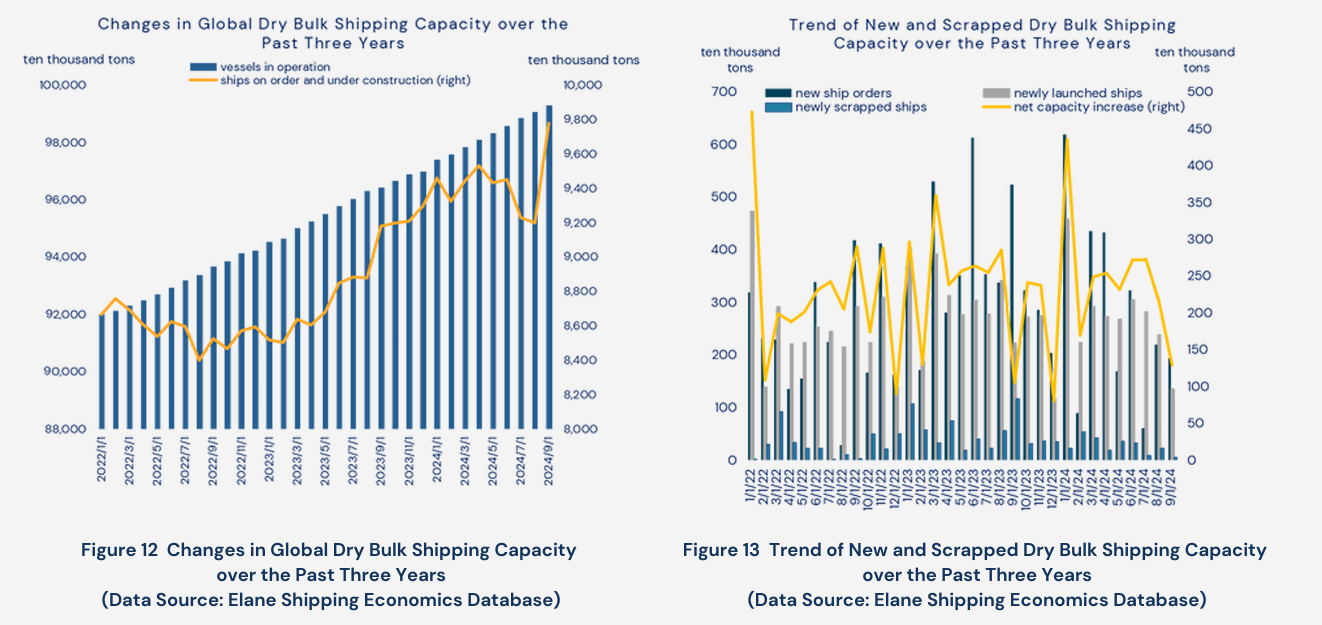
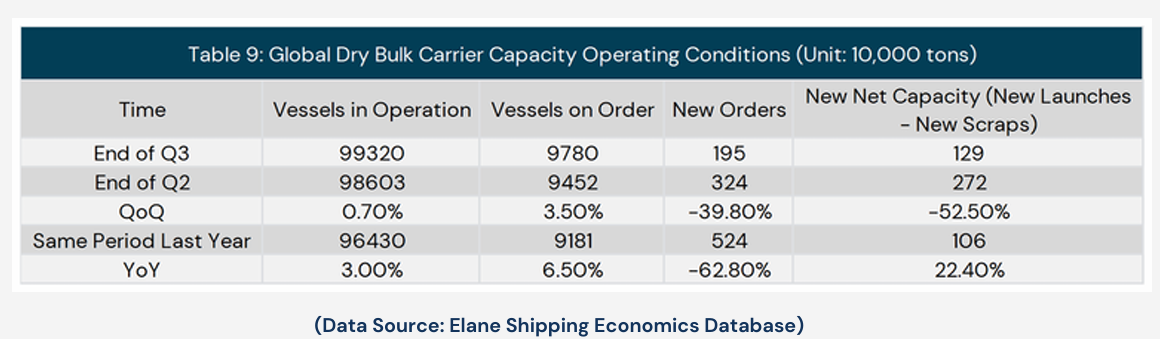
Vessel operational capacity has reached new highs, but the number of new orders began to decline in the third quarter, indicating a slight lack of marginal growth momentum. Since the third quarter of last year, the number of vessels on order has shown a narrow upward trend, with capacity being gradually released from the third quarter of this year until the end of next year. There are signs that the market for future new capacity may have peaked, with new orders for vessels seeing a year-on-year decrease of 62.8%. The net increase in capacity fell by 52.5% compared to the previous quarter.
The number of newly scrapped vessels remains low, staying below 300,000 tons. Given the current high levels of dry bulk index prices and low scrap steel prices, it is expected that the volume of scrapped vessels will continue to remain at this low level.
Future Supply
In the third quarter, the high port arrivals maintained elevated iron ore freight rates while suppressing China's domestic spot prices. There was also structural differentiation in port arrivals, with significant increases at ports with strong trading turnover attributes, while ports of direct-use iron ore experienced a year-on-year decline in arrivals. Coupled with the decline in domestic pig iron production and the phenomenon of increasing inventory at ports, the steel industry is responding to China's carbon peak policy by reducing output.
In the first three quarters in 2024, China's steel exports increased by 14 million tons year-on-year, marking a continuous creation of historical highs in exports, which indicates that China's steel consumption is showing signs of reaching a peak and is transforming into a net exporter of finished steel products, making it more sensitive to changes in the steel-mineral price differential.
Looking ahead to the fourth quarter, freight rates are expected to decline. According to data from Elane, available bulk carriers have already concentrated in the Cape of Good Hope, and the capacity squeeze can no longer continue to worsen. Any marginal benefits from the Red Sea crisis will improve long-distance shipping conditions. Although there will be winter storage replenishment demand for iron ore by the end of the fourth quarter, the high port arrivals triggered by increased production in Brazil, along with high inventory levels at ports, are likely to eliminate any potential demand gap. Therefore, iron ore supply in the fourth quarter is expected to remain loose, with ongoing downward pressure on prices.
As an independent third party, we track and record in real-time the circulation of every port, every ship, every cargo of crude oil, natural gas, coal, iron ore, grain, and containers globally. This data provides reliable evidence and innovative perspectives for the operational and investment decisions of industry-leading enterprises, ultimately forming a competitive advantage